US Bullying/Harassment Data Analysis Report

On a hot Summer day at St. Mark’s School, I, a chubby international freshman from South Korea had no clue what was going on. Intimidated by the tall white and black classmates around me, I hardly left my room, too shy to engage. To make things worse, I got bullied every single night by my roommate as I was hit with a belt or his shoes, without no apparent reason. In a boarding school, absent from parental help, I did not have anyone to consult or reach out to. Eventually, my advisor found out about this situation, which got my roommate expelled from the school. Still, in my last year of high school, the experience lingers in my head from time to time. Now that I am much more comfortable with the environment, I have numerous great friends around me who support me and are fun to be around. However, I have noticed that there is a lot of hazing and bullying still present at my school and the neighboring schools at Massachusetts. This observation has driven me to take action. To attempt to remedy this situation where students in the minority are having terrible high school experiences because of bullying, I decided to utilize statistics and data analytics to find out the trends of bullying/harassment present in the United States and statistical anomalies, which then I will figure out and suggest an effective intervention method for bullying in high school to reduce the number of bullying efficaciously. Thus, my ultimate goal is to propose an effective intervention method to reduce bullying in high schools and improve the experience for students, particularly those from minority backgrounds.
For data acquisition, I used datasets from the National Department of Social Justice and the National Center for Education Statistics. The datasets were cleaned and analyzed using Microsoft Excel and Tableau.
First, looking at the principal statistics, approximately 13 million students get bullied each year. Among them, 43% of teens, ages 13 to 17, have experienced cyberbullying in the past year, and 29% experienced physical bullying. Of teachers, 25% see nothing wrong with bullying and consequently, intervene in only 4% of bullying incidents. Additionally, 85% of bullying is not responded to appropriately or at all. As these rates show, the bullying problem in the United States is an apparent problem that can demolish the victims’ lives. For example, after interviewing 41 school shooters in 37 incidents, the Secret Service found that 2/3 had been bullied, and their attacks were motivated by a will to seek revenge. Thus, it should be noted that there should be an effective intervention method for bullying and harassment in school promptly.
In addition, these four graphs show the bullied rate of each race by state:
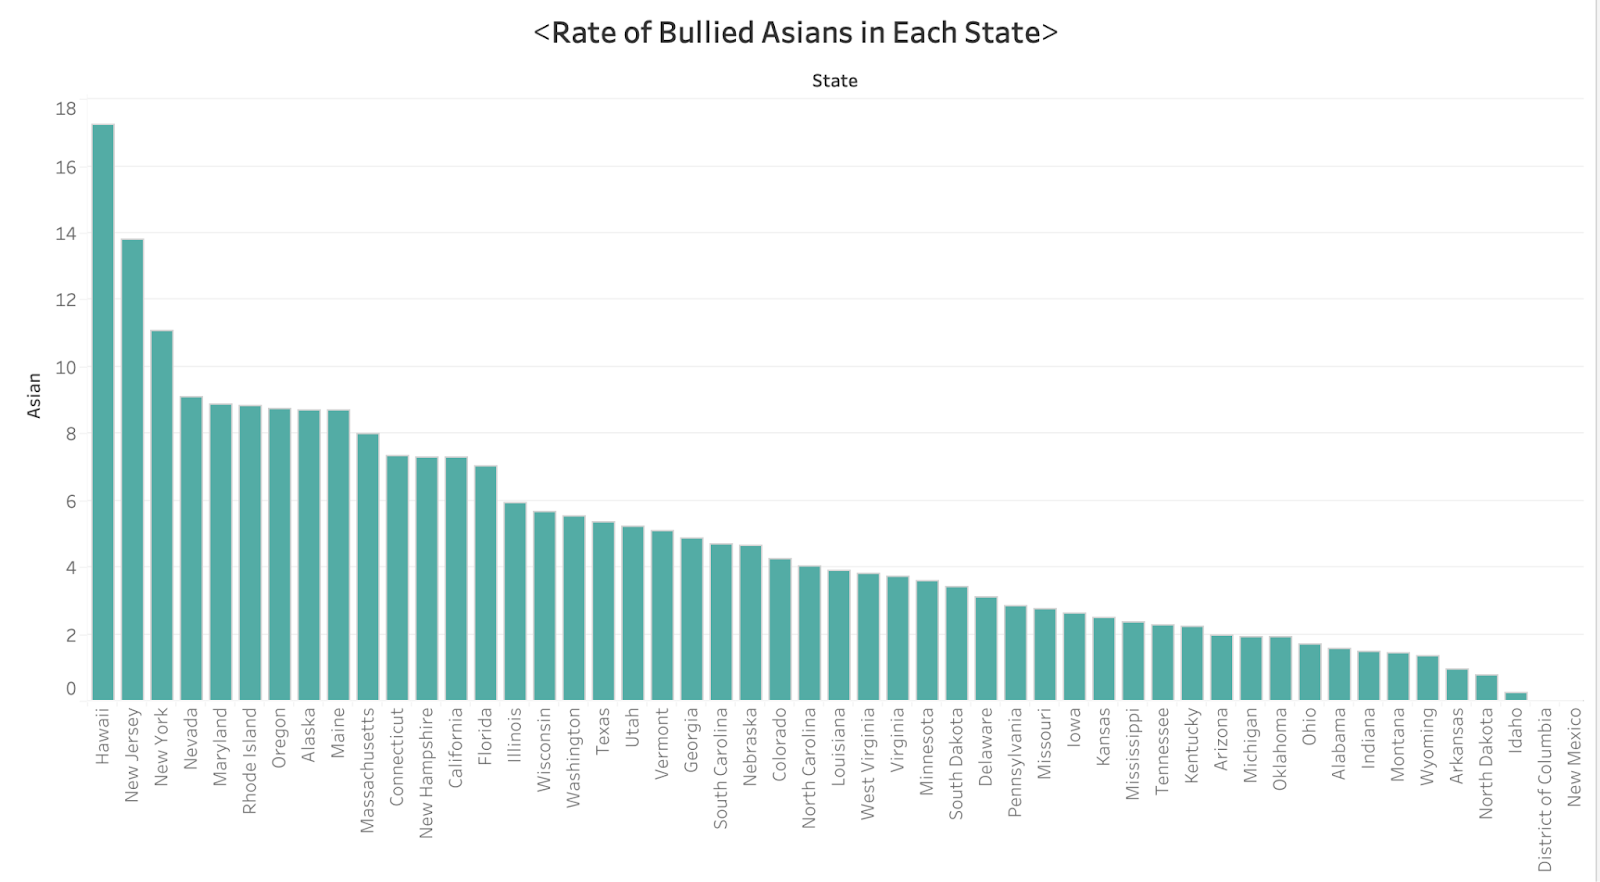
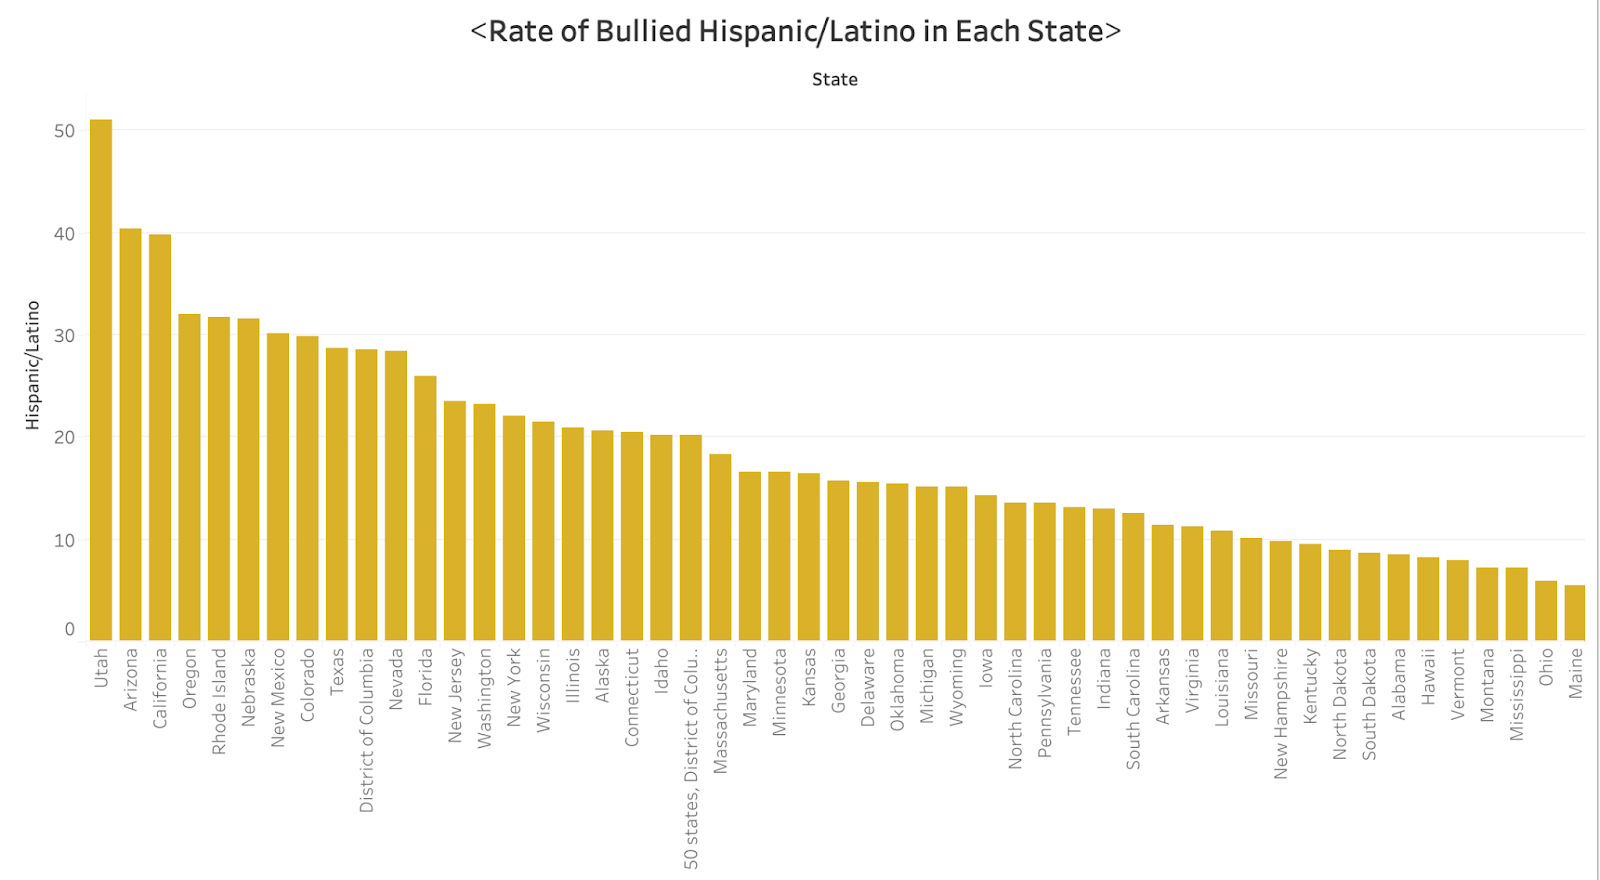
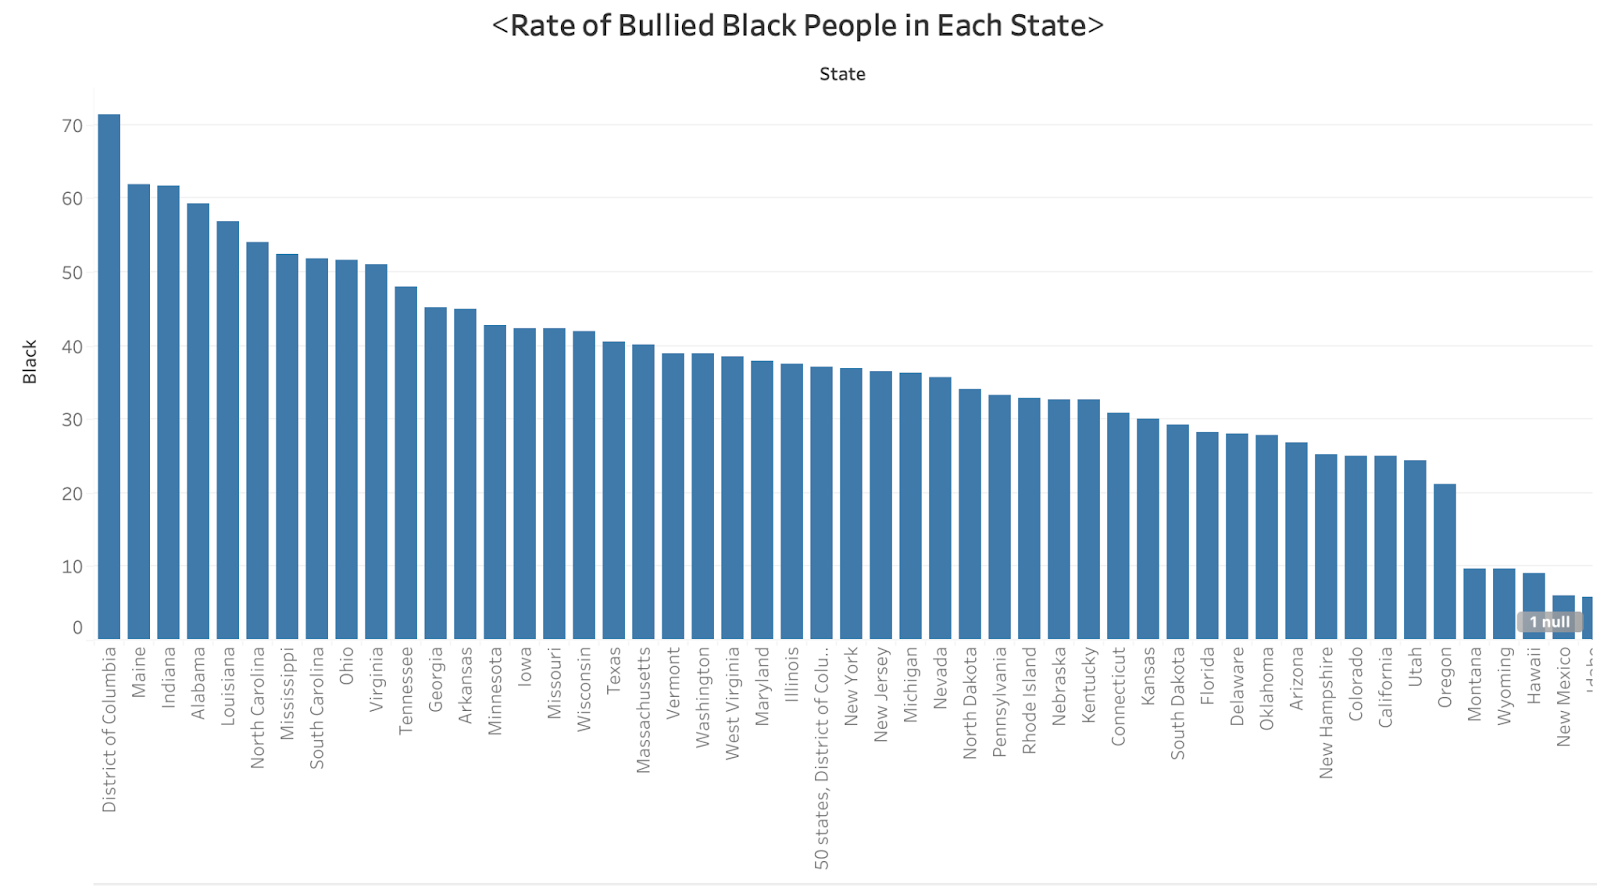
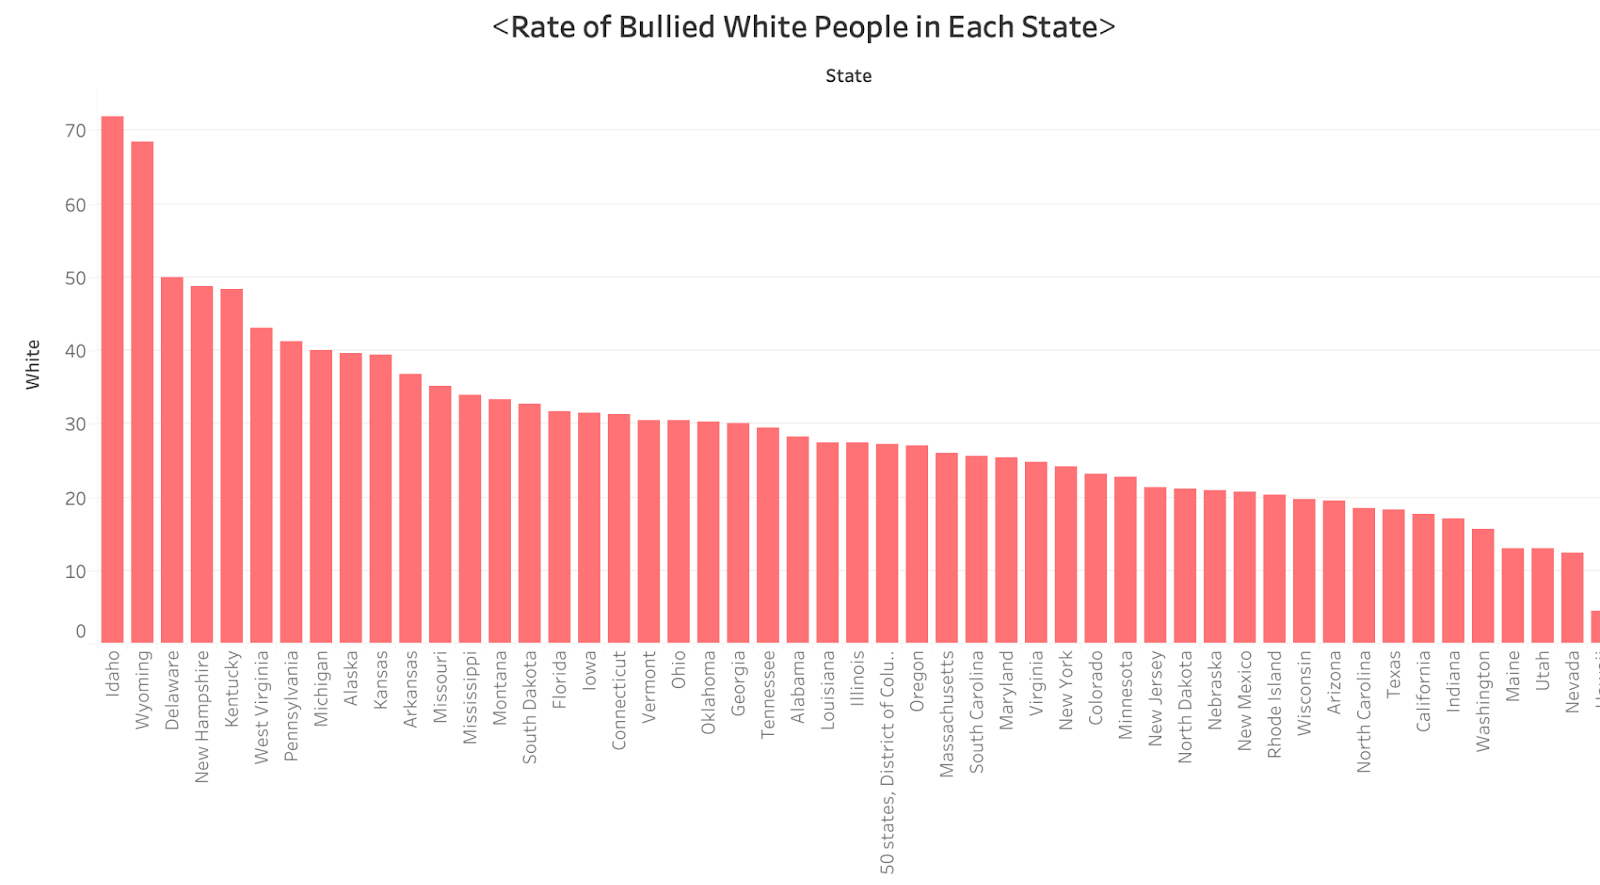
As can be seen, the rate of bullied Asians is the highest in Hawaii, New Jersey, New York, Nevada, Maryland, and Rhode Island. On the other hand, the rate of bullied Hispanics/Latinos is the highest in Utah, Arizona, California, Oregon, Rhode Island, Nebraska, and New Mexico. That of black people is highest in Maine, Indiana, Alabama, and Louisiana. Lastly, the rate of bullied White people is highest in Idaho, Wyoming, Delaware, New Hampshire, Kentucky, and West Virginia. The associations of this graph with others will be treated later in this paper.
Now, onto the specifics: Specific influential factors such as area, school size, the percentage of colored students, and grade will be discussed using graphical representations.
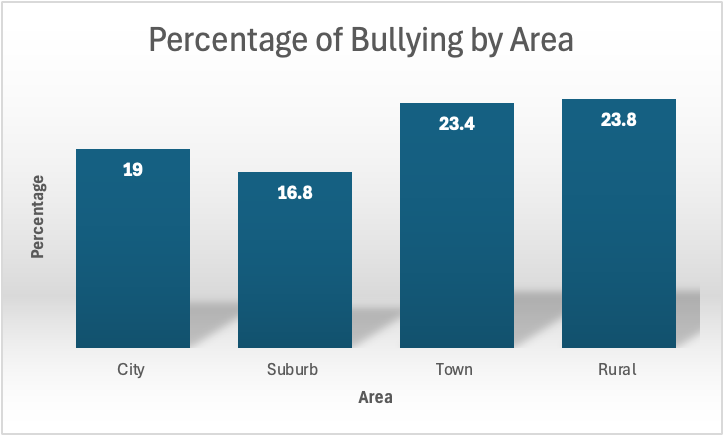
First, looking at the bar graph of the percentage of bullying by area, bullying did not occur as much in cities and suburbs as in town and rural areas, as the former has a rate of less than 20% while the latter has a rate of over 20%. For future research, the proportion of people of color in cities, suburbs, towns, and rural areas to investigate the diversity of each area. The result showed a range from 50% to as high as 70% for cities, around 35-45% for suburban areas, 20-30% for towns, and 10-20% for rural areas. This information, with the graph, can be connected to the graph “Bullying by Percentage of Students of Color Enrolled”, as attached:
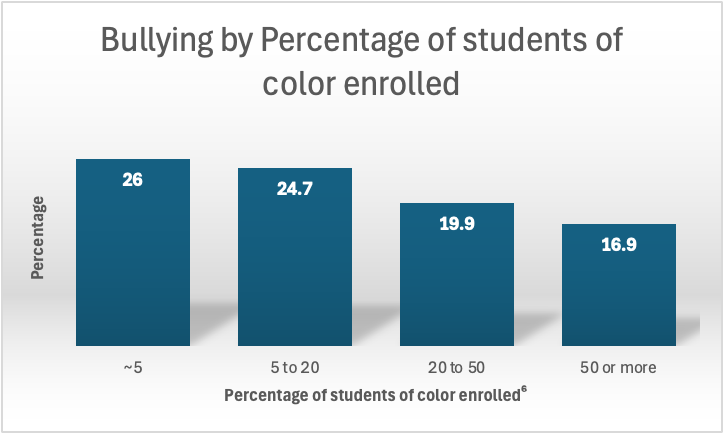
This graph shows an inverse relationship between the percentage of students of color enrolled in school and the percentage of bullying. Specifically, while the rate of bullying is 26% when the percentage of POC is less than 5%, it is 16.9% when the percentage of POC is 50% or more. With this information, the previous graph of the Percentage of bullying by area is more intuitive as it can be implied that, in communities or schools where there is little diversity, students may not have the opportunity to interact with people from different racial or ethnic backgrounds. This lack of exposure can breed misunderstanding, fear, and discomfort with those who are perceived as “different,” which can manifest in bullying.
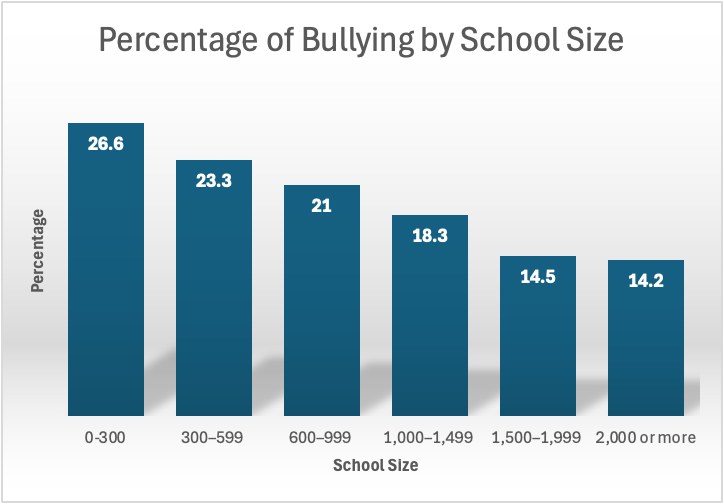
The third graph to be analyzed is “Percentage of Bullying by School Size,” as shown on the next page of this paper. Similar to the previous graph, this graph also shows an inverse relationship between the percentage of bullying and school size: schools with less than 300 students have a higher bullying rate than schools with over 2,000 students (26.6% vs. 14.2%). According to an organization Mid-Atlantic Equity, larger schools, especially those resulting from the consolidation of smaller schools, may serve a wider geographic area and thus have a more diverse student body. However, in rural areas where schools consolidate, the resulting institutions may still reflect the racial homogeneity of the broader rural population. Coming from this lack of diversity, there can be a higher rate of racial discrimination in school, resulting in bullying, harassment, and hazing the minorities.
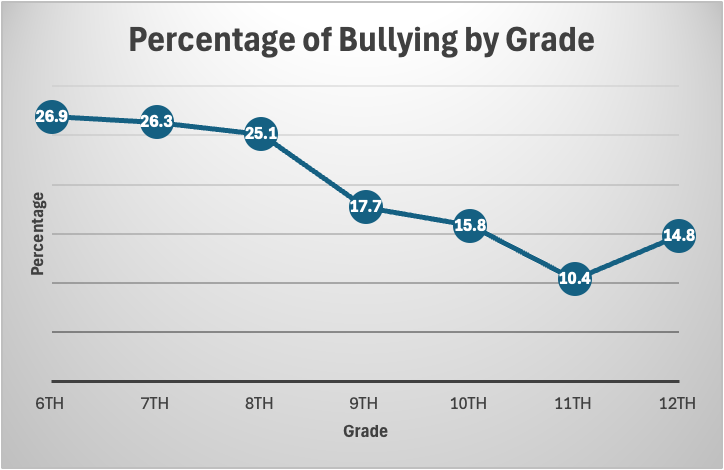
The last graph to be analyzed is the percentage of bullying by grade. As it is shown, as students go up a grade, the rate of bullying generally decreases, with 26.9% bullying percentage to 10.4% bullying percentage from 6th to 11th grade. This extreme downward trend shows the importance of the personal growth of individuals in their perception of what is right and wrong as they enter puberty, a crucial stage of life in the internal and external development of their bodies. There is a statistical anomaly in that of the 12th grade, where the rate goes up slightly after the constant decrease. This may be because of the increased stress and change of power dynamics during their last year of high school: Seniors are often under significant stress from college applications, academic performance, and transitioning out of high school. This pressure can sometimes manifest in aggression or bullying behavior as a way to cope with anxiety, frustration, or competition.
Also, in many high schools, 12th graders are viewed at the top of the social hierarchy. This "senior privilege" can embolden some students to engage in bullying as a way of exerting power over younger students, particularly if they feel they can do so with fewer consequences as they prepare to leave the school.
Thus, to promote a better development and understanding of the consequences of the action of bullying/harassment, proper education on school violence prevention and intervention in school from a young age is crucial. Going back to the point that 25% of teachers see nothing wrong with bullying and consequently, intervene in only 4% of bullying incidents, changing the perception and expressing the urgency of this matter to the instructors in school can also be a benefactor in decreasing the rate of bullying and harassment, making a better future for the minorities who are currently in danger.