Data Analysis for 2023/2024 Varsity Basketball Team

To begin with, it should be noted that the players in St. Mark’s Varsity Basketball team have had a great amount of increase in their skills and competency compared to last year and that there are several valuable additions to the team despite the loss of last year’s seniors such as Aj Gorman, Tru Styles, and Ryan Taylor.
In this data analysis report, I will be looking at two main sections based on the films and data from last season: Last year’s St. Mark’s Varsity basketball team and the opposing teams that we faced. I was interested in investigating individual players’ data and scouting reports on the starting 5, but the level increase in the team’s skill has changed quite a lot and the fact that there are few losses and additions made me think this part of data analysis will be suitable after a few scrimmages where I can have valuable live data on those players.
- 2022/2023 St. Mark’s Basketball Team
First of all, I was able to find that there is a very apparent factor in the difference between the first and second periods.
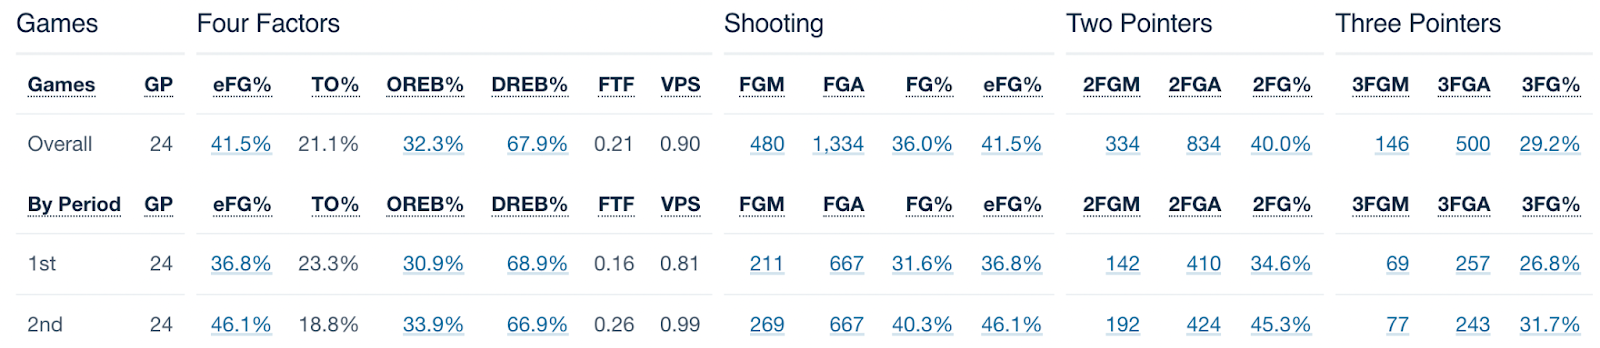
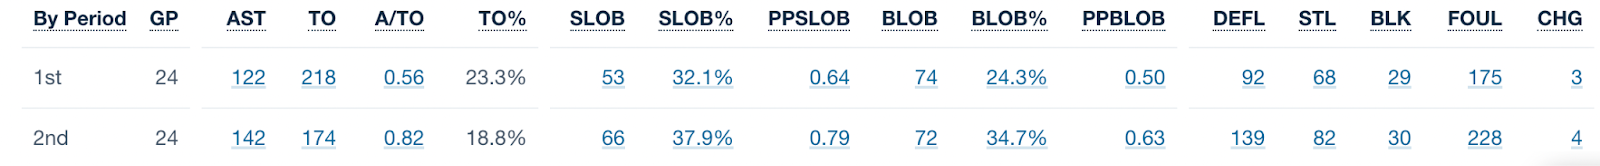
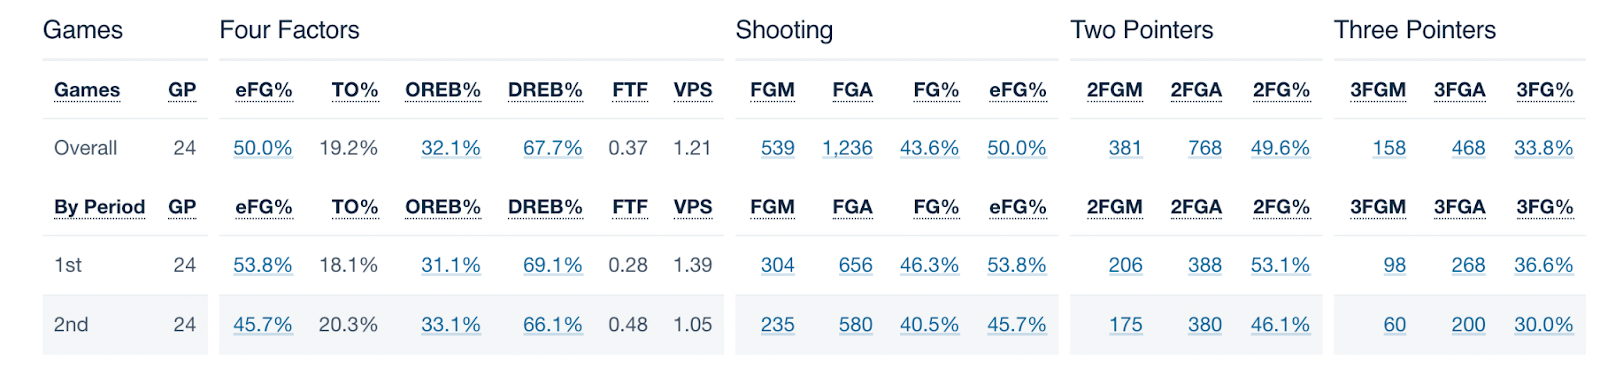
As can be seen from the data sets from 24 games, the team is starting off comparatively slow since almost every single stats from the 2nd period is better than those from the 1st period. Some significant factors among those are the difference in the field goal percentage (31.6% vs 40.3%), TO% (23.3% vs 18.8%) that shows how often a possession turns into a turnover, and inbound efficiency (PPSLOB and PPBLOB). *Note: I think the stats for the game against Milton Academy are not consistent with the total points.
Then, I looked at the trends about how much each difference in stats contributed to win/loss.
First of all, I found out that the difference of 3pt% between St. Mark’s and the opposing team contributes to team win/loss.
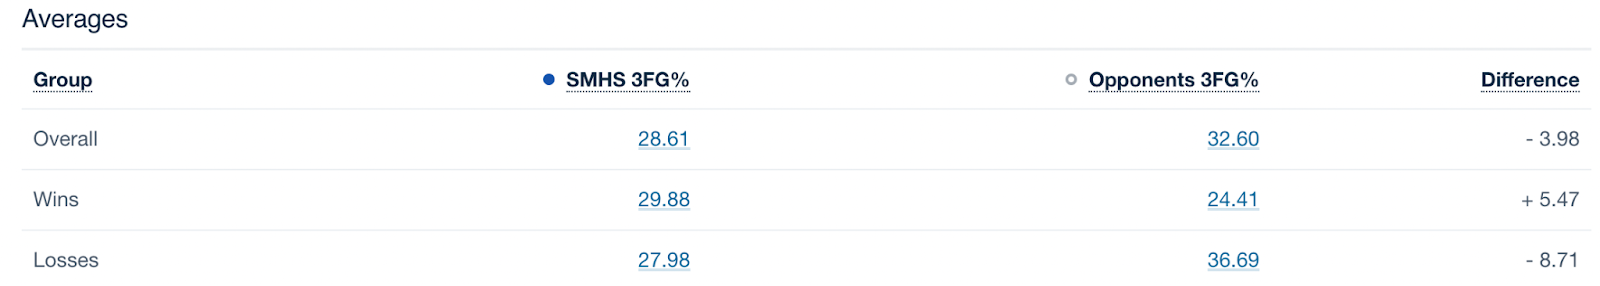
As can be seen in this data set, overall this team’s 3FG% last season was quite low compared to opponents (28.61% vs 32.60%). In addition, the 3FG% for St. Mark’s when they won was higher than the average (29.88%), and the defense against 3-pointers was effective as the team was able to secure the opposing team with 24.41% 3FG%. However, in the situation of losses, the difference of 3FG% between St. Mark’s and the opposing team was considerable (27.98% vs 36.69%). In my opinion, the 3FG% for St. Mark’s itself is not that bad, but giving 36.69% for the opposing team is quite a lot, so I think this team needs to find an effective plan/tactic to have a better defense of good 3-point shooters for the opposing teams. Also, for our 3-point offense last year, I looked at the season shot chart.
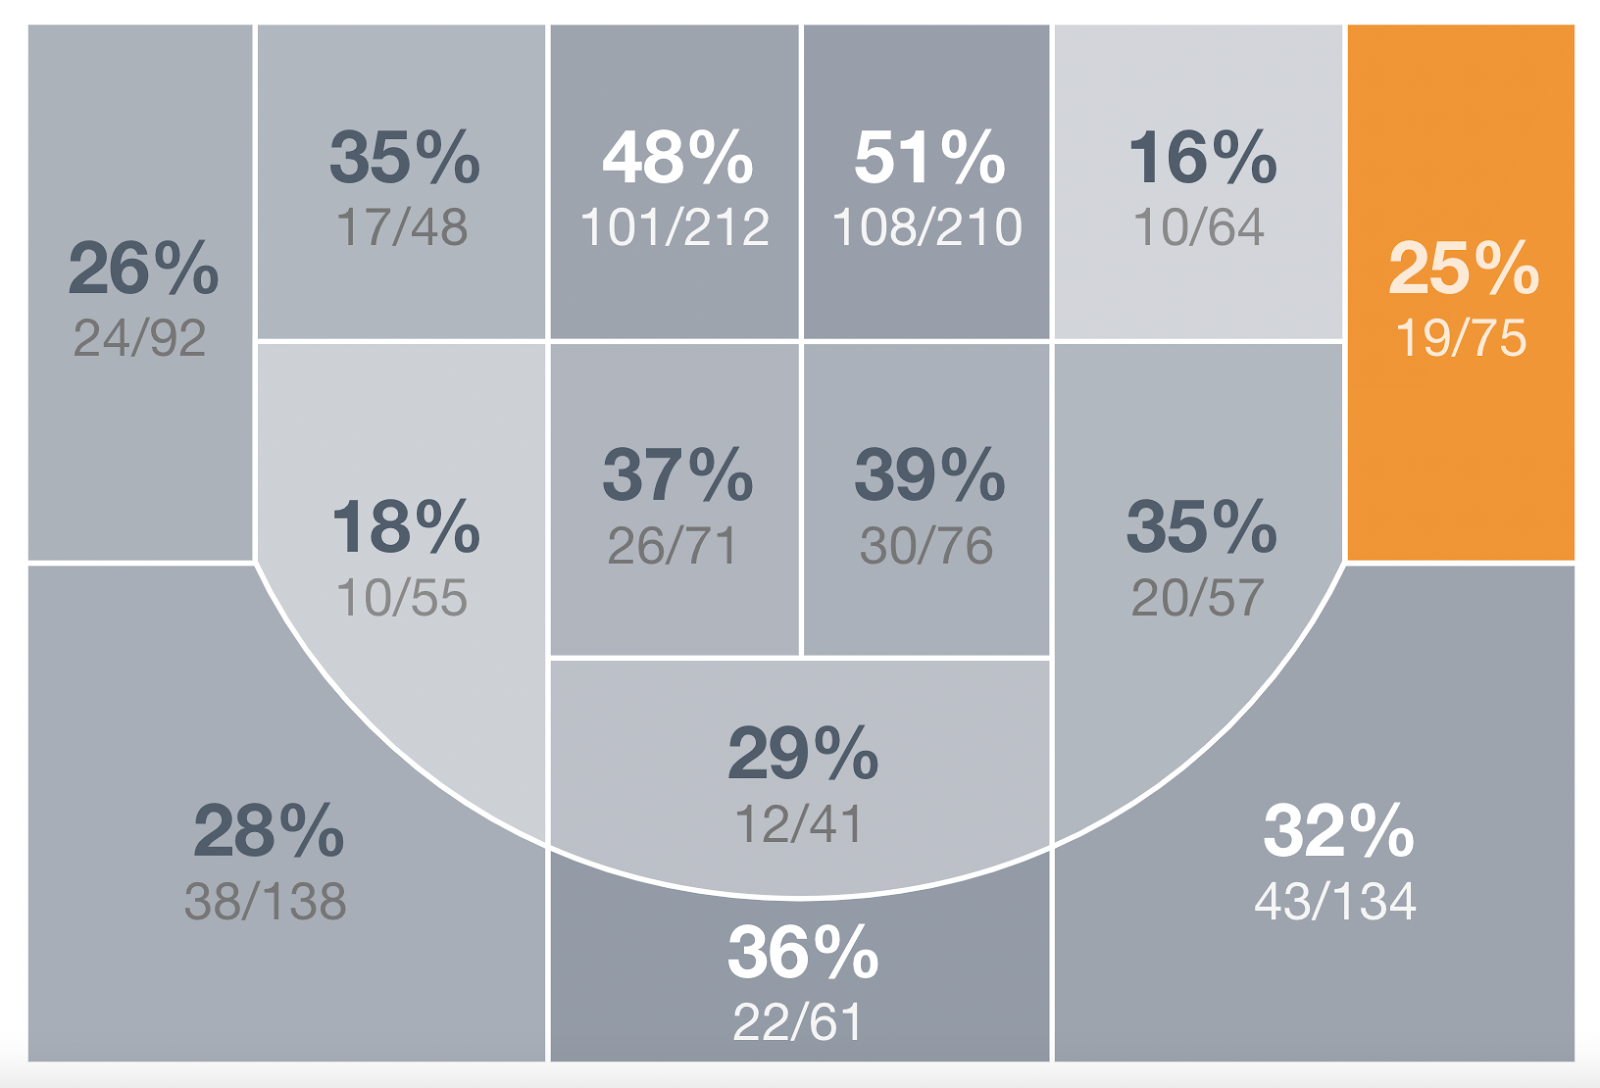
From this shot chart, I was able to find somewhat consistent data to the one mentioned before. The 3FG% for the corners is relatively low considering that other areas have more or less 30% 3FG%. I think a high 3FG% for corner areas is crucial since many times, corner shots will not be as much contested as other areas, as stated in the Cornell University course blog for economics(https://blogs.cornell.edu/info2040/2021/09/18/what-makes-corner-3s-in-the-nba-so-efficient-and-how-can-defenders-better-respond-to-limit-them/#:~:text=While%20this%20is%20certainly%20a,in%20them%20being%20less%20contested). Also, I am not sure about this since I was not on the team last year, but I believe many of the offensive plans require the person in the corner is the one shooting the most threes, but please correct me if I am wrong. On the other hand, we can look at this stat from a different perspective, a more positive one. Since the overall 3FG% for the nose and 45-60 degrees is high, it would be effective to make a strategy to have the one in that area be the priority rather than the one in the corner.
In addition, the overall FG% difference between the games we won and lost is quite a lot. (41.91% vs. 32.97%), but the free throw attempts per game for St. Mark’s were no different when we won and lost (11.13 vs. 11.88). This might be considered a meager factor, but I don’t think so. I think when the team is losing or when the FG% is off in games, sometimes the team has to change the strategy to get more calls on shooting fouls so that we can at least accumulate lacking points by free throws. I am not saying we have to do this every single time when we are having bad games, but I am pretty sure that this tactic will help to some extent.
- 2022/2023 Opposing Teams
I want to start off with brief and apparent data on the opposing teams. On the contrary to St. Mark’s, the opponents tend to start off very strong and seem to cool down after the 1st period. This might be due to two main reasons:
- Since this team tended to get momentum quite slowly, the opponents in the first half were able to take advantage of this fact and outscore St. Mark’s. However, since SM starts getting it going and opposing teams will lose a huge amount of stamina after the performance in the first half, they will be likely to lose focus and relative competency, causing them to have an increase in negative data sets such as TO% and a significant decrease in overall field goal percentage.
- Since the coaches from the opposing teams would think that the game would be a blowout, they might put in bench players, which could facilitate the offense for St. Mark’s.
Since the reason for this performance is unknown, I was honestly not sure whether to write my assumption and analysis on this part of the data set in my report, but I believe the stat itself about the lack of high-quality performance from the opposing team will help the coaching staffs for SM to have a better tactic for each period to some extent.
In addition, compared to St. Mark’s, the opposing teams overall have a better eFG%, which is based on the claim that 3-pointers are more valuable than long twos, and also a high 2FG%. Intrigued by these relatively high data values compared to St. Mark’s offense, I went on to shot charts for the opposing teams as a whole.
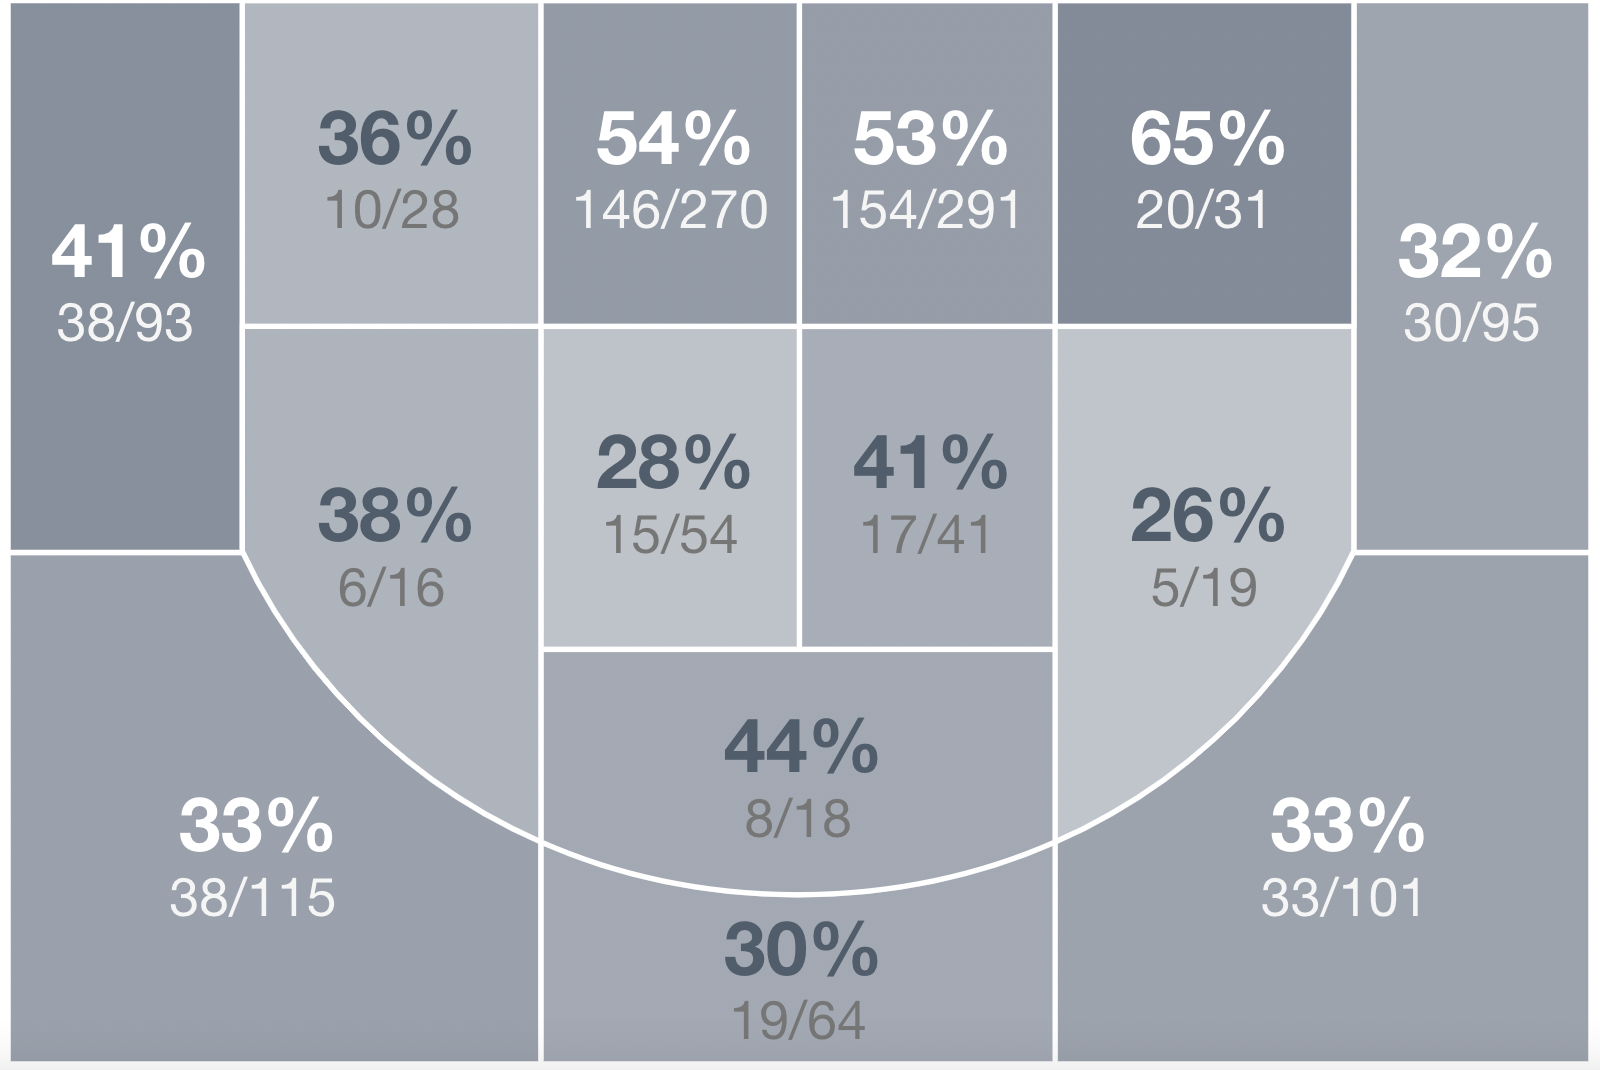
St. Mark’s shot chart Opposing teams' shot chart
From these two shot charts, it seems reasonable to state that the opponents are making higher-quality shots, meaning that the proportion of the combined field goal attempts in the paint zone and outside the perimeter is much higher compared to the offense coming out from St. Mark’s (St. Mark’s long two to effective field goal ratio= 265:1069 vs. Opponents long two to effective field goal ratio= 112:1124), which is twice larger than the ratio from St. Mark’s offense. From this data set, I was able to assume that the team had been giving up comparatively easy points to the opponents, while we were struggling to shoot from the paint compared to the other teams. However, I have heard from Devon Reid ’24 that in the Summer NEPSAC tournament, the team was able to create a great number of buckets, so for this problem from the past, it would be a good idea for the coaching staffs to take a closer look at for the first few scrimmages and games.
Closing
Since this is my first time making a report on data analysis, please consider that the data I used and the assumptions and analysis on the data sets are not that advanced. However, I am confident that the data sets that I found during my research will be a good asset to this year’s St. Mark’s Varsity Basketball Team. Before ending this report, I would like to thank Coach Perron again for giving me this beyond-valuable opportunity.